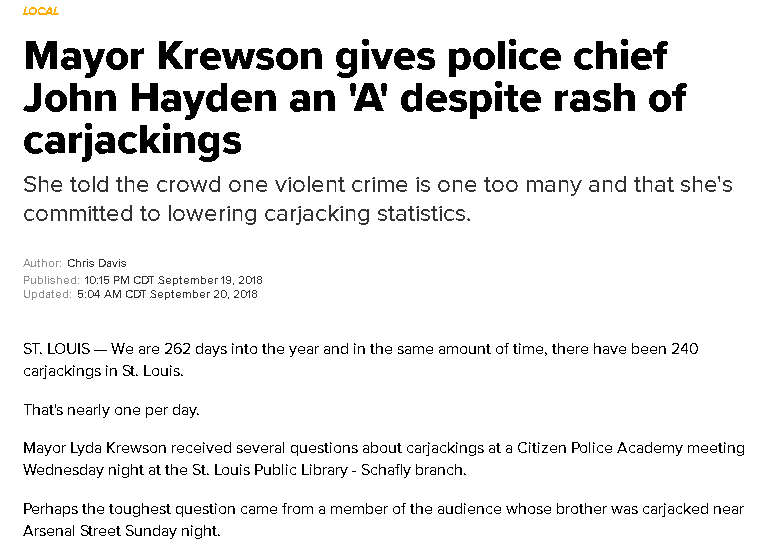
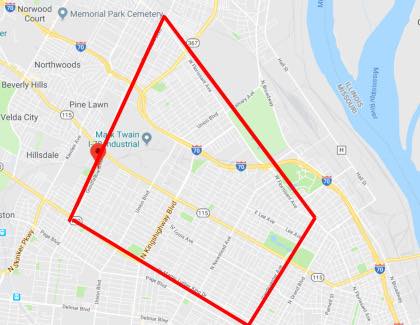
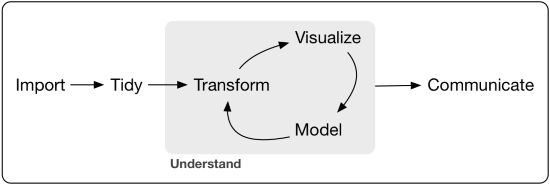
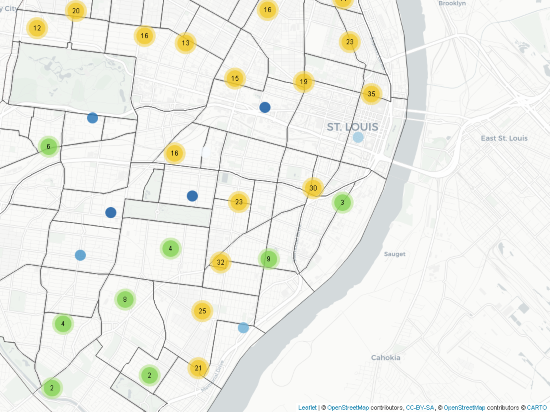
class: center, middle background-image: url(images/police.jpg) background-size: cover # St Louis Crime <img src=""/> ## Carjacks and Homicides in the Gateway City .large[Jim Donovan | Stl DS & AI Meetup | 14 Jan 2020] <br> github: https//:donojazz.github.io/Crime --- class: inverse, top, center  # Concerned About Crime in St Louis? -- ## Three Major Factors Key to Understanding Crime -- **Type of Crime** <br> -- **Location of Crime** <br> -- **Time of Day Crime Occurred** --- class: inverse ## What Led Me to Do This Study .center[] --- class: inverse <br> **Find an interesting project to get a greater understanding of R.** .right[] -- <br> **Find a project to gain greater understanding of geospatial analysis techniques.** .right[] -- **Finally, as a response to a channel 5 news report on increased carjackings (Sep 2018)** .right[] -- <br> **So, decided to investigate for myself** .right[] --- class: inverse .center[ **"I would give the Chief an **"A"** for his performance."**] <br> .center[] --- class: inverse .center[ **"Chief Hayden Rectangle"** ] .center[] .center[ From intersection of Goodfellow and MLK. North along Goodfellow to W. Florissant. Then Southeast along W. Florissant to Prarie. Then southwest along Prarie/Vandeventner to MLK. Back to MLK and Goodfellow. ] --- class: inverse, center, top <img src="images/data-vs-information-300x126.jpg" width ="800", height = "200"> <br> <br> # My Background --- class:inverse <img src="images/mitreImage.jpg" width ="700", height = "200"> # .center[ MITRE Corporation (FFRDC) ] - Network and Systems Engineer - Transportation Systems Consultant - Enterprise Architect - Integrated transportation systems troubleshooter (28) + Data Analyst/Investigator/CSI - Service Oriented Architecture (SOA) Schema Developer --- class: inverse # .center[This Was A Great Learning Project] **Used plenty of R Tools (21 libraries)** -- <br> **Tidyverse + ** - Data.table, DPLYR, STRINGR, FORCATS, LUBRIDATE, GGPLOT2 -- <br> **Geospatial libraries ** - SP, SF, RGDAL, Leaflet, MAPVIEW, PLOTLY, GGMAP, Tidycensus, Censusxy, OpenStreetMap -- <br> **Github ** - Github Pages, Website, Jekyll -- <br> **Repeatable Research ** - RMarkdown, Xaringan, Reveal_js, R-flexdashboard --- class: inverse, center, middle # **Tidyverse Methodology** <br> <br> <br> .center[] --- class: inverse # .center[What I Learned About Police Data] -- Data is inconsistent and needs a lot of work to "TIDY" - Plots and addresses missing -- Duplicate crime identifiers for same crime type - STMP Claims that records keys are unique - not really -- Multiple data sets offered - Police Reports Division offers data (PDF) - Police Crime Analysis offers (PDF or CSV) -- Uniform Crime Reporting (UCR) System very inconsistent across cities -- Arbitrary descriptions of crimes (free **text** descriptions) --- class: inverse # .center[Started with Carjacking Then Moved to Homicides ] -- Started downloading data in October 2018 - Eventually collected data for 2 years -- Started with carjacks due to the **Channel 5** news story - Moved on to homicides - a small change in data with same analysis structure (crime code - 38111 to 10000) - Potential to create **Shiny** App for other crime codes -- Discovered "Hot Spots" with heatmaps, custers, and histograms - Found significant diferences between "Crime Box" and crime locations -- Discovered that 70% of homicides occurred in 22 of the neighborhoods -- Noticed that Hayden Rectangle missed a lot of the crime **"hot spots"**. - Just like **St Louis Dispatch** (Janelle O'Dea) stated last Sunday --- class:inverse, center, middle # .center[**Go to Analyses**] .center[]